Plot graphs of GEV+ fit
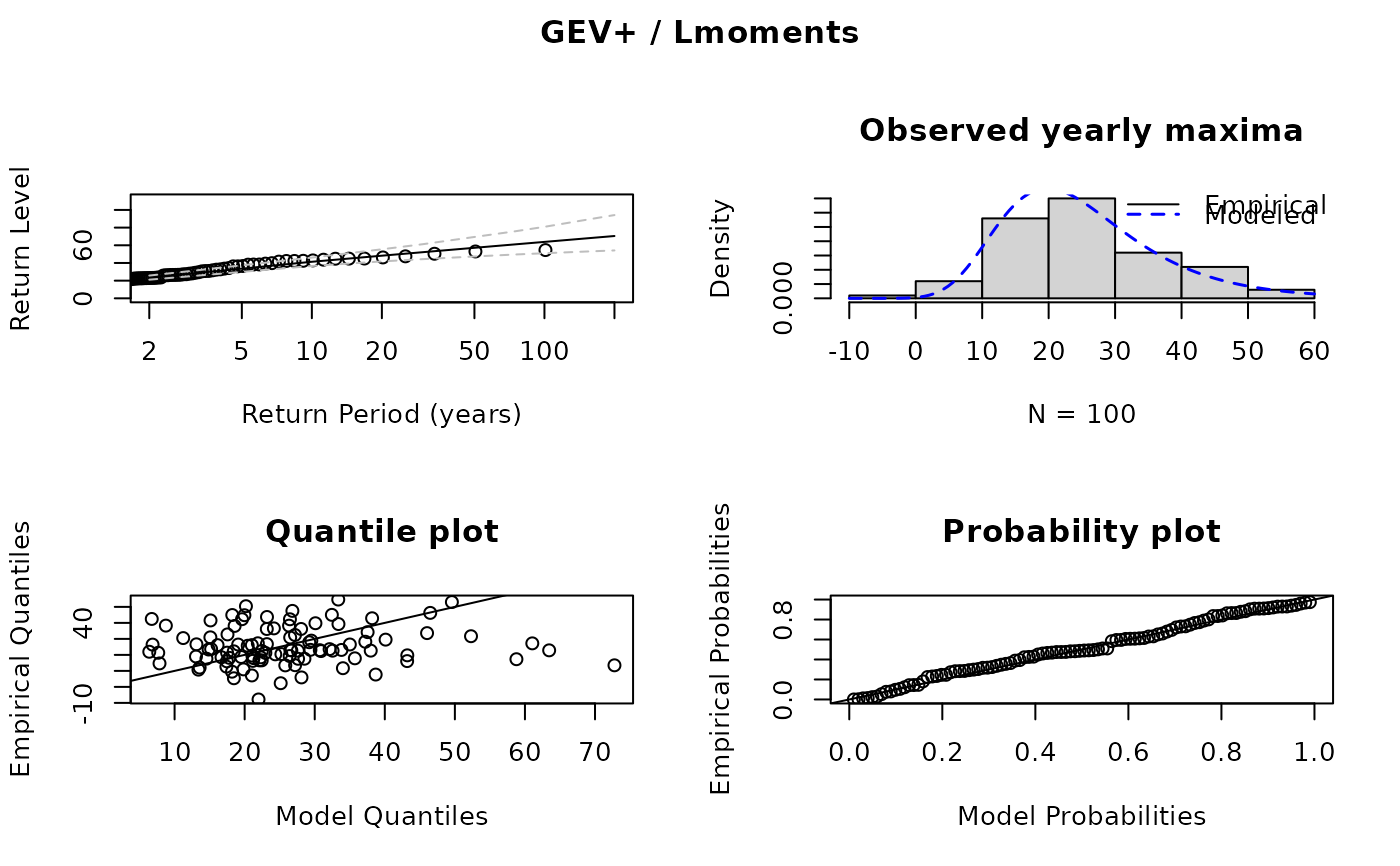
plot.gevplus.RdA return level plot, qq-plot, pp-plot and a histogram with the fitted density is produced
Arguments
- x
An object of class
gevplus- q
vector of return periods, \(q > 1\).
- ci
if
ci=TRUE, confidence intervals will be computed.- type
if omitted a panel with a return level plot (
type='rl', a density plot (type='hist'), a qq-plot (type='qq') and a probability plot (tpe='pp') are shown.- ...
Further parameters for plotting or confidence interval calculation (alpha, R) may also be supplied as arguments. See e.g. plot.
Examples
z <- extRemes::revd(100, loc = 20, scale = 10, shape = -0.2)
fit <- fgevplus(z)
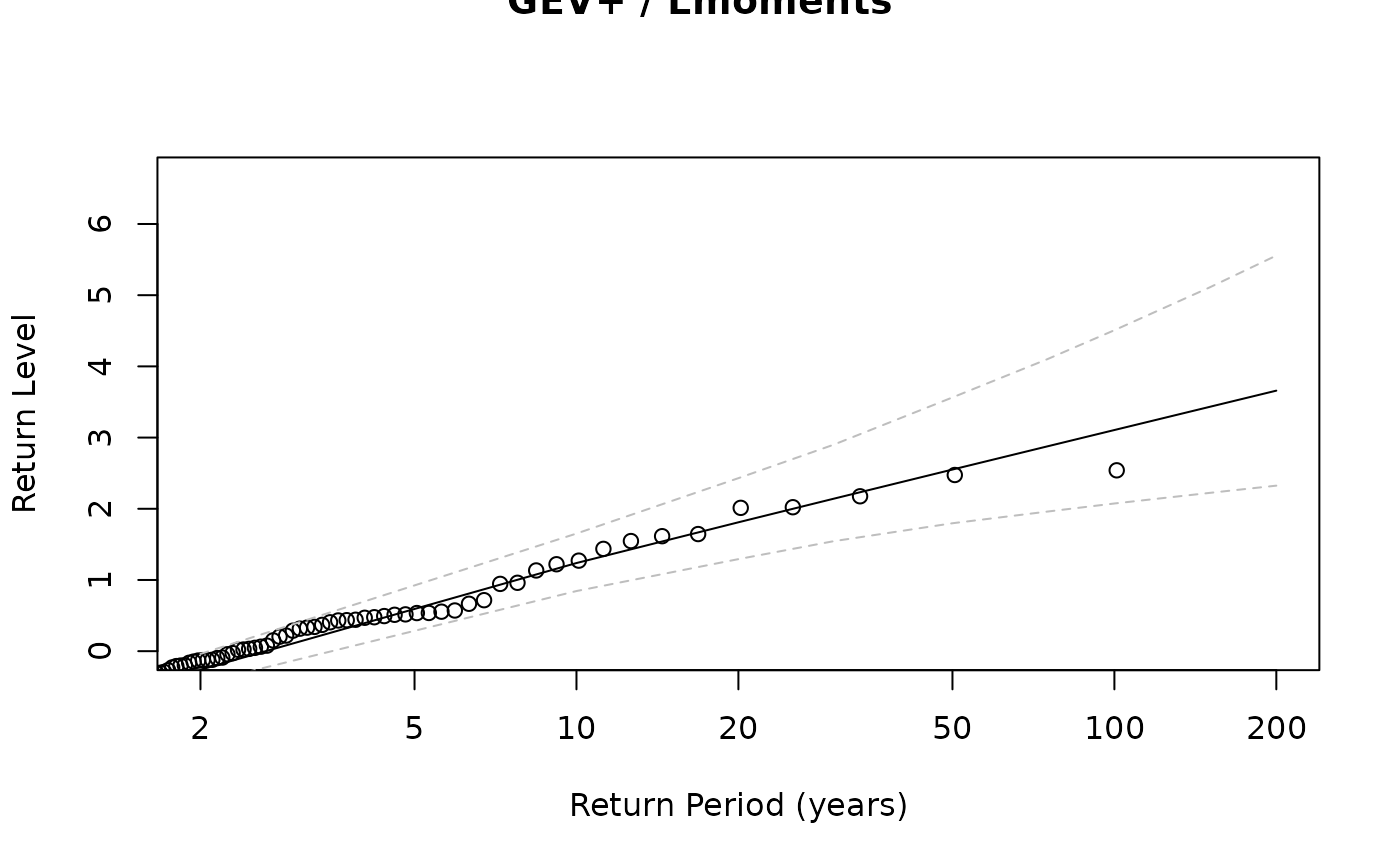
plot(fit, ci = TRUE)
 # Compare standard GEV with GEV+
z <- rnorm(100)
rp <- c(2, 10, 20, 30, 50, 75, 100, 150, 200)
fit_gev <- extRemes::fevd(z)
fit_gevplus <- fgevplus(z)
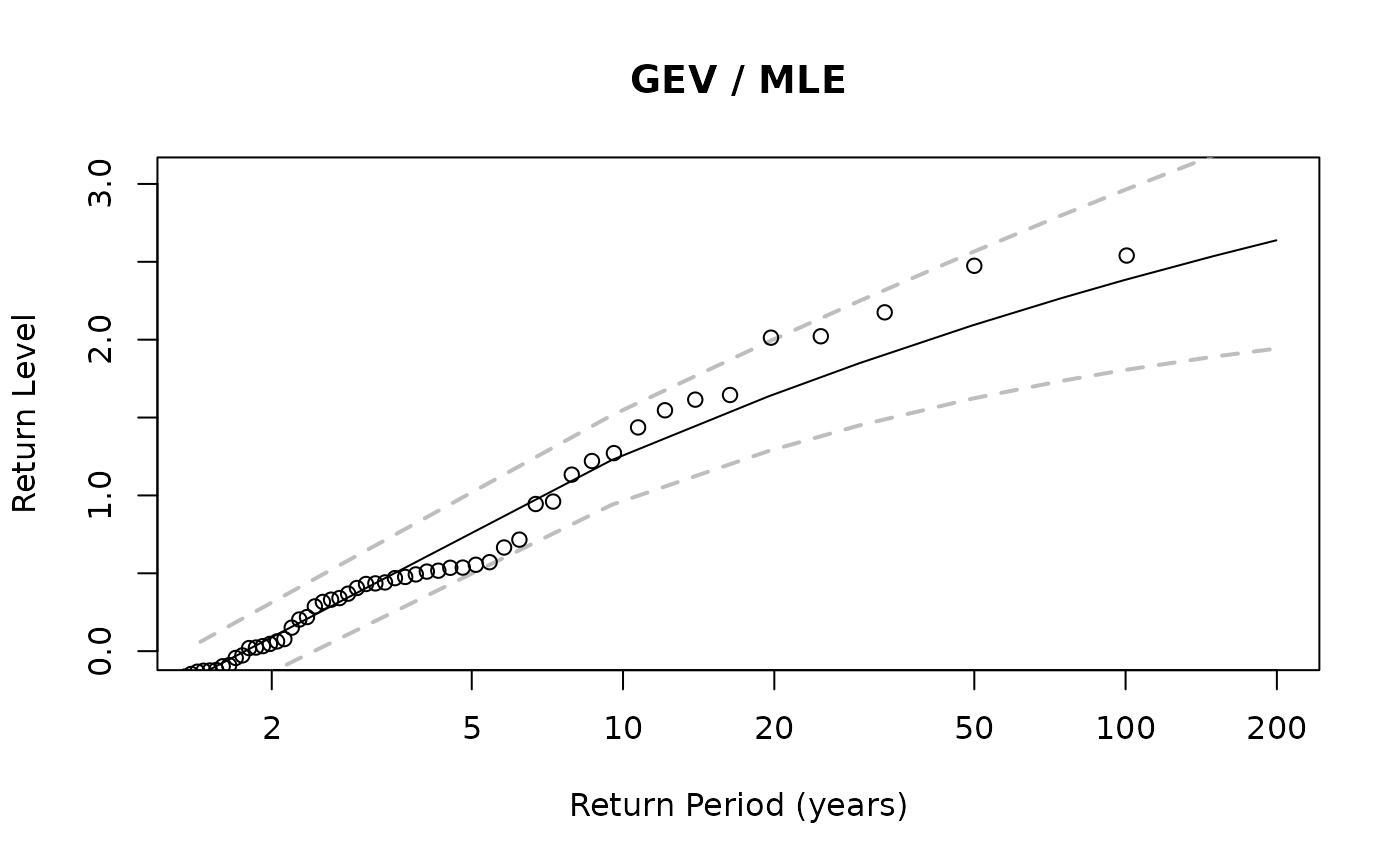
plot(fit_gev, rperiods = rp, type = "rl", ylim = c(0, max(z) * 1.2),
main = paste0(fit_gev$type, " / ", fit_gev$method))
# Compare standard GEV with GEV+
z <- rnorm(100)
rp <- c(2, 10, 20, 30, 50, 75, 100, 150, 200)
fit_gev <- extRemes::fevd(z)
fit_gevplus <- fgevplus(z)
plot(fit_gev, rperiods = rp, type = "rl", ylim = c(0, max(z) * 1.2),
main = paste0(fit_gev$type, " / ", fit_gev$method))
 plot(fit_gevplus, q = rp, ci = TRUE, type = "rl")